
SharePoint Search 2013 infrastructure totally changed and now in 2013 provides the great OOB tools that help to troubleshoot the problem more easily. Monitor the crawl and query rates and latency and generate the reports.
So the following are the some of the great tools that exist in the SharePoint 2010 Fast Infrastructure but 2013 it adds more options in crawl logs also display the crawl and query health reports in form of charts.
Crawl logs: The crawl logs basic first level entry where the SharePoint administrator checks the crawl status. So the following are the options that added in the existing crawl logs that gives the more help in terms of analysis the & check the performance of the crawler.
- Content Source (added 1, 7 and 30 day duration trend)
- URL View (Added new link remove from index)
- History( added new column Latency and load)
 |
| Content source |
 |
| URL View |
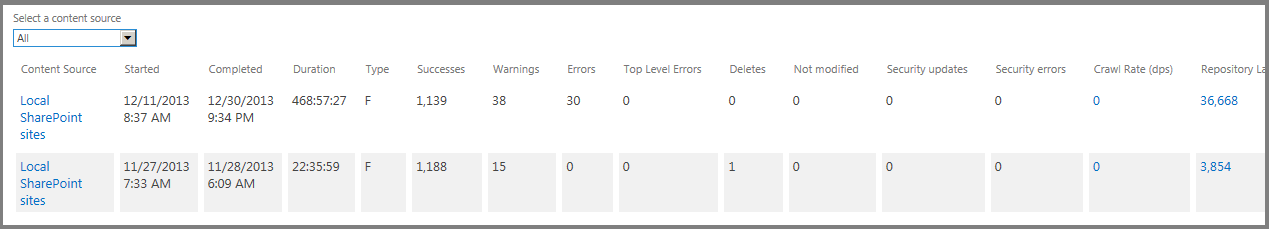 |
| History View |
- Crawl Rate (dps): Crawl rate per type that includes (Modified, not modified, security only, deleted, retry and error ) and crawl rate per content source (document per second).
- Crawl Latency: Crawl load (In crawler queue, Waiting for content Plugin, Submitting to CTS, Waiting for commit(SQL) ) and latency time (Repository, Protocol handler, crawler, CTS and SQL)
- Crawl Freshness: Shows the content freshness that includes aggregate freshness and pre day & mins.
- CPU & Memory Load : Total CPU usage and memory usage also more details chart about the memory usage by Process(MSSDMN, MSSearch,NodeRunner andTimer) and CPU usage by process (MSSDMN, MSSearch,NodeRunner andTimer)
- Content Processing Activity(Processing items): content process activity taken by each process (WordBreaker, term extractor ,Security insert, Search Analysis, Property mapping, profiler manager extractor, phonenumber normalization, OOTBextraction, noIndex, MetadataExtractor, Language Detector, indexing, document summary ect)
- Crawl Queue(items): shows the items are queue (Links to Process and Transaction queued)
- Continues Crawl(Tiime/Discovery time) : Display the performance of the continues crawl (Links Table, crawler, protocol handler, repository, content pipeline,SQL and Queue table.

Query Health Report: Display the health report card of the query site. This report would help the take decision on the query time. How much time would take to process the query?

- Trend(Query latency m.sec/items per second): display the crawl rate and analytics update rates Overall : Show the overall reports
- Main Flow(Query latency m.sec/items per second): Trend of the query in terms of (Query rule condition matching, Query routing, layout selection, query logging, query transformation, result mixing and other)
- Federation: That includes (Best bet provider, local SharePoint Provider, personal favorites providers, Exchange search provider, open search provider, remote search provider and local people provider)
- SharePoint Search Provider: That’s include (keyword parsing, linguistics, Recommendation security trimming ,security token construction ,index lookup ,Result type processing, custom security trimming, summary generation and other)
- People Search Provider :That’s include (keyword parsing, linguistics, Recommendation security trimming ,security token construction ,index lookup ,Result type processing, custom security trimming, summary generation and other)
- Index Engine: latency by the content source (Index lookup)
Usage Reports: The usage reports shows the usage reports as well as the search reports that included the list of following csv file generating by the timer jobs that helps the Search analyst to take the decision and check the trend of the keyword and query that mostly search by the users. Following are the list of the reports.
- Number of query
- Top queries by day
- Top queries by month
- Abandoned queries by day
- Abandoned queries by month
- No Result queries by day
- No Result queries by month
- Query rule usage by day
- Query rues usage by month

Developer Dashboard: In SharePoint 2013 developer dashboard comes with more options and it has more option it trace each and every request like the fiddler. The good news is that now not required to physically check the ULS logs now the ULS logs option there.
- Server Info
- Scopes
- SQL
- SPRequest
- Asserts
- Service Calls
- ULS
- Cache Calls

Comments
Post a Comment